Changes and Corrections
Last update: November 29, 2010
|
EarthStructure (2nd edition;
2nd and up printing)
Changes and Corrections Last update: November 29, 2010 |
Minor correction were made in the second print run of the second edition. The corrections below only address this 2nd printing. Please let me know what you find (vdpluijm@umich.edu) and I will post them here. Ben
Fig 3.10
Plane 6 should show right shear couple
Figure 4.11
in (d), j should be
j'
Fig 6.29 modified caption
Aerial
view of the Landers Fault, which is a strand of the San Andreas Fault system;
north of Landers, California.
Fig 7.17
(a) sigma(t) should be removed (it parallels sigma3, but the arrow would be
opposite; all compressive stresses)
(b) should show right shear couple (reverse fault)
Fig 8.15 (p 178)
Reference omitted: Roy W. Schlische, Scott S. Young, Rolf V. Ackermann, Anupma Gupta, 1996. Geometry and scaling relations of a population of very small rift-related normal faults Geology v. 24, p. 683-686.
p 227-228 (Table 9.4, Fig 9.31). An interesting consideration on recrystallized grain size is given by Austin and Evans (Geology, 2007, p.343), who argue that d is a paleowattmeter (that is, reflecting work done) instead of a paleopiezometer (paleostress gauge).
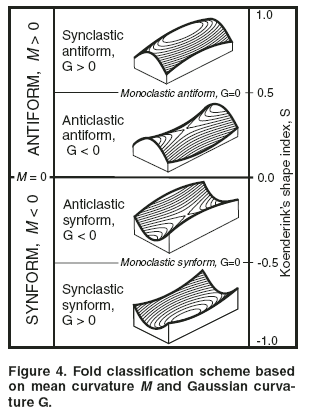
p 243-up. Fold classification. A
simple, quantitative approach to classify folds in three-dimensions is presented
in "Defining folds on three-dimensional surfaces", by Richard J. Lisle and Noel
C. Toimil (Geology, 2007, p519); see below.

p.252-up: Superposed folding
A useful hands-on approach using papermodels can be found here:
http://www.fault-analysis-group.ucd.ie/SuperPosedFolds/Superposed_PM_Index.html#Anchor_PMindex
Figure 11.19
on (c), replace relationship with:
w'' < w
l'' > l
A3 = l'' x w'' = A1
Figure 13.3 corrected and improved caption:
Reliable geobarometers (solid band) shift location depending on pressure and are
largely temperature insensitive, whereas good geothermometers (dashed band)
shift location based on temperature and are largely pressure independent; they
are schematically plotted in P-T space.
p. 362, equation 14.3
the angular plate velocity is missing in equation:
v = ω ri sin Θ, where ω is the angular plate velocity.
Figure 18.4a Inversion
The arrows in (a) should indicate normal displacement, not reverse; arrows in (b) are correct.
Figure 18.23a caption should say:
Cross section sketch of a roadcut near Catskill, New York, showing cleavage and
mesoscopic folds developed in thrust sheets of the Hudson Valley fold-thrust
belt.
Figure 19.1a Garlock Fault
The Garlock Fault is left lateral (not right lateral as shown), which is
associated with the curvature of the SAF.
Ch 22.2, page 566, end of 2nd paragraph: "..... an average thickness of 300–500 m of compacted sedimentary rock ......" (not 300-500km).
Minor text edits
p 384 f 16.2 aulacogen
p 427, F 17.17 Bering Sea
(c) Ben van der Pluijm, 2005; visit #